Stewart Precalc 6e Section 1.9: Graphing Calculators; Solving Equations and Inequalities Graphically

86 questions

--:--
0 / 86
Stewart Precalc 6e Section 1.9: Graphing Calculators; Solving Equations and Inequalities Graphically 0/86
1 Concepts - x-intercepts and equation solutions · Level 1
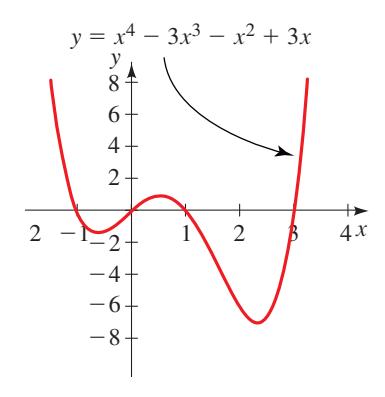
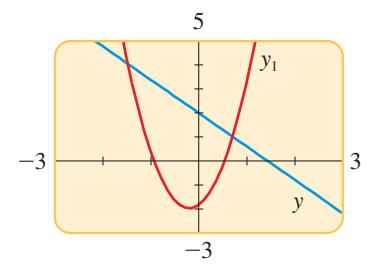
The solutions of the equation \(x^2 - 2 x - 3 = 0\) are the ____-intercepts of the graph of \(y = x^2 - 2 x - 3\).
2 Concepts - inequalities and graphs · Level 1
The solutions of the inequality \(x^2 - 2 x - 3 > 0\) are the x-coordinates of the points on the graph of \(y = x^2 - 2 x - 3\) that lie ____ the x-axis.
3 Concepts - reading a quartic graph · Level 2
The figure shows a graph of \(y = x^4 - 3 x^3 - x^2 + 3 x\). Use the graph to do the following. (a) Find the solutions of the equation \(x^4 - 3 x^3 - x^2 + 3 x = 0\). (b) Find the solutions of the inequality \(x^4 - 3 x^3 - x^2 + 3 x \leq 0\).
question image
4 Concepts - reading two graphs together · Level 2
The figure shows the graphs of \(y = 5 x - x^2\) and \(y = 4\). Use the graphs to do the following. (a) Find the solutions of the equation \(5 x - x^2 = 4\). (b) Find the solutions of the inequality \(5 x - x^2 > 4\).
question image
5 Skills - viewing rectangle selection · Level 1
Use a graphing calculator or computer to decide which viewing rectangle (a)-(d) produces the most appropriate graph of the equation \(y = x^4 + 2\).
A
\([-2, 2]\) by \([-2, 2]\)
B
\([0, 4]\) by \([0, 4]\)
C
\([-8, 8]\) by \([-4, 40]\)
D
\([-40, 40]\) by \([-80, 800]\)
6 Skills - viewing rectangle selection · Level 1
Use a graphing calculator or computer to decide which viewing rectangle (a)-(d) produces the most appropriate graph of the equation \(y = x^2 + 7 x + 6\).
A
\([-5, 5]\) by \([-5, 5]\)
B
\([0, 10]\) by \([-20, 100]\)
C
\([-15, 8]\) by \([-20, 100]\)
D
\([-10, 3]\) by \([-100, 20]\)
7 Skills - viewing rectangle selection · Level 1
Use a graphing calculator or computer to decide which viewing rectangle (a)-(d) produces the most appropriate graph of the equation \(y = 100 - x^2\).
A
\([-4, 4]\) by \([-4, 4]\)
B
\([-10, 10]\) by \([-10, 10]\)
C
\([-15, 15]\) by \([-30, 110]\)
D
\([-4, 4]\) by \([-30, 110]\)
8 Skills - viewing rectangle selection · Level 1
Use a graphing calculator or computer to decide which viewing rectangle (a)-(d) produces the most appropriate graph of the equation \(y = 2 x^2 - 1000\).
A
\([-10, 10]\) by \([-10, 10]\)
B
\([-10, 10]\) by \([-100, 100]\)
C
\([-10, 10]\) by \([-1000, 1000]\)
D
\([-25, 25]\) by \([-1200, 200]\)
9 Skills - viewing rectangle selection · Level 1
Use a graphing calculator or computer to decide which viewing rectangle (a)-(d) produces the most appropriate graph of the equation \(y = 10 + 25 x - x^3\).
A
\([-4, 4]\) by \([-4, 4]\)
B
\([-10, 10]\) by \([-10, 10]\)
C
\([-20, 20]\) by \([-100, 100]\)
D
\([-100, 100]\) by \([-200, 200]\)
10 Skills - viewing rectangle selection · Level 1
Use a graphing calculator or computer to decide which viewing rectangle (a)-(d) produces the most appropriate graph of the equation \(y = \sqrt{8 x - x^2}\).
A
\([-4, 4]\) by \([-4, 4]\)
B
\([-5, 5]\) by \([0, 100]\)
C
\([-10, 10]\) by \([-10, 40]\)
D
\([-2, 10]\) by \([-2, 6]\)
11 Skills - choose viewing rectangle and graph · Level 2
Determine an appropriate viewing rectangle for the equation \(y = 100 x^2\), and use it to draw the graph.
12 Skills - choose viewing rectangle and graph · Level 2
Determine an appropriate viewing rectangle for the equation \(y = -100 x^2\), and use it to draw the graph.
13 Skills - choose viewing rectangle and graph · Level 2
Determine an appropriate viewing rectangle for the equation \(y = 4 + 6 x - x^2\), and use it to draw the graph.
14 Skills - choose viewing rectangle and graph · Level 2
Determine an appropriate viewing rectangle for the equation \(y = 0.3 x^2 + 1.7 x - 3\), and use it to draw the graph.
15 Skills - choose viewing rectangle and graph · Level 2
Determine an appropriate viewing rectangle for the equation \(y = \sqrt[4]{256 - x^2}\), and use it to draw the graph.
16 Skills - choose viewing rectangle and graph · Level 2
Determine an appropriate viewing rectangle for the equation \(y = \sqrt{12 x - 17}\), and use it to draw the graph.
17 Skills - choose viewing rectangle and graph · Level 2
Determine an appropriate viewing rectangle for the equation \(y = 0.01 x^3 - x^2 + 5\), and use it to draw the graph.
18 Skills - choose viewing rectangle and graph · Level 2
Determine an appropriate viewing rectangle for the equation \(y = x (x + 6)(x - 9)\), and use it to draw the graph.
19 Skills - choose viewing rectangle and graph · Level 2
Determine an appropriate viewing rectangle for the equation \(y = x^4 - 4 x^3\), and use it to draw the graph.
20 Skills - choose viewing rectangle and graph · Level 2
Determine an appropriate viewing rectangle for the equation \(y = x/(x^2 + 25)\), and use it to draw the graph.
21 Skills - choose viewing rectangle and graph · Level 2
Determine an appropriate viewing rectangle for the equation \(y = 1 + |x - 1|\), and use it to draw the graph.
22 Skills - choose viewing rectangle and graph · Level 2
Determine an appropriate viewing rectangle for the equation \(y = 2 x - |x^2 - 5|\), and use it to draw the graph.
23 Skills - intersection of graphs · Level 2
Do the graphs intersect in the given viewing rectangle? If they do, how many points of intersection are there? \(y = -3 x^2 + 6 x - \dfrac{1}{2}\), \(y = \sqrt{7 - \dfrac{7}{12} x^2}\); \([-4, 4]\) by \([-1, 3]\).
24 Skills - intersection of graphs · Level 2
Do the graphs intersect in the given viewing rectangle? If they do, how many points of intersection are there? \(y = \sqrt{49 - x^2}\), \(y = \left(\dfrac{1}{5}\right)(41 - 3 x)\); \([-8, 8]\) by \([-1, 8]\).
25 Skills - intersection of graphs · Level 2
Do the graphs intersect in the given viewing rectangle? If they do, how many points of intersection are there? \(y = 6 - 4 x - x^2\), \(y = 3 x + 18\); \([-6, 2]\) by \([-5, 20]\).
26 Skills - intersection of graphs · Level 2
Do the graphs intersect in the given viewing rectangle? If they do, how many points of intersection are there? \(y = x^3 - 4 x\), \(y = x + 5\); \([-4, 4]\) by \([-15, 15]\).
27 Skills - graphing a circle · Level 2
Graph the circle \(x^2 + y^2 = 9\) by solving for \(y\) and graphing two equations as in Example 3.
28 Skills - graphing a circle · Level 2
Graph the circle \((y - 1)^2 + x^2 = 1\) by solving for \(y\) and graphing two equations as in Example 3.
29 Skills - graphing an ellipse · Level 2
Graph the equation \(4 x^2 + 2 y^2 = 1\) by solving for \(y\) and graphing two equations corresponding to the negative and positive square roots. (This graph is called an ellipse.)
30 Skills - graphing a hyperbola · Level 2
Graph the equation \(y^2 - 9 x^2 = 1\) by solving for \(y\) and graphing the two equations corresponding to the positive and negative square roots. (This graph is called a hyperbola.)
31 Skills - solve equation algebraically and graphically · Level 1
Solve the equation both algebraically and graphically: \(x - 4 = 5 x + 12\).
32 Skills - solve equation algebraically and graphically · Level 1
Solve the equation both algebraically and graphically: \(\dfrac{1}{2} x - 3 = 6 + 2 x\).
33 Skills - solve equation algebraically and graphically · Level 2
Solve the equation both algebraically and graphically: \(\dfrac{2}{x} + 1/(2 x) = 7\).
34 Skills - solve equation algebraically and graphically · Level 2
Solve the equation both algebraically and graphically: \(4/(x + 2) - 6/(2 x) = 5/(2 x + 4)\).
35 Skills - solve equation algebraically and graphically · Level 1
Solve the equation both algebraically and graphically: \(x^2 - 32 = 0\).
36 Skills - solve equation algebraically and graphically · Level 2
Solve the equation both algebraically and graphically: \(x^3 + 16 = 0\).
37 Skills - solve equation algebraically and graphically · Level 1
Solve the equation both algebraically and graphically: \(x^2 + 9 = 0\).
38 Skills - solve equation algebraically and graphically · Level 2
Solve the equation both algebraically and graphically: \(x^2 + 3 = 2 x\).
39 Skills - solve equation algebraically and graphically · Level 2
Solve the equation both algebraically and graphically: \(16 x^4 = 625\).
40 Skills - solve equation algebraically and graphically · Level 2
Solve the equation both algebraically and graphically: \(2 x^5 - 243 = 0\).
41 Skills - solve equation algebraically and graphically · Level 2
Solve the equation both algebraically and graphically: \((x - 5)^4 - 80 = 0\).
42 Skills - solve equation algebraically and graphically · Level 2
Solve the equation both algebraically and graphically: \(6 (x + 2)^5 = 64\).
43 Skills - solve graphically on an interval · Level 1
Solve the equation graphically in the given interval. State each answer rounded to two decimals. \(x^2 - 7 x + 12 = 0\); \([0, 6]\).
44 Skills - solve graphically on an interval · Level 2
Solve the equation graphically in the given interval. State each answer rounded to two decimals. \(x^2 - 0.75 x + 0.125 = 0\); \([-2, 2]\).
45 Skills - solve graphically on an interval · Level 2
Solve the equation graphically in the given interval. State each answer rounded to two decimals. \(x^3 - 6 x^2 + 11 x - 6 = 0\); \([-1, 4]\).
46 Skills - solve graphically on an interval · Level 2
Solve the equation graphically in the given interval. State each answer rounded to two decimals. \(16 x^3 + 16 x^2 = x + 1\); \([-2, 2]\).
47 Skills - solve graphically on an interval · Level 2
Solve the equation graphically in the given interval. State each answer rounded to two decimals. \(x - \sqrt{x + 1} = 0\); \([-1, 5]\).
48 Skills - solve graphically on an interval · Level 3
Solve the equation graphically in the given interval. State each answer rounded to two decimals. \(1 + \sqrt{x} = \sqrt{1 + x^2}\); \([-1, 5]\).
49 Skills - solve graphically on an interval · Level 2
Solve the equation graphically in the given interval. State each answer rounded to two decimals. \(x^{\dfrac{1}{3}} - x = 0\); \([-3, 3]\).
50 Skills - solve graphically on an interval · Level 3
Solve the equation graphically in the given interval. State each answer rounded to two decimals. \(x^{\dfrac{1}{2}} + x^{\dfrac{1}{3}} - x = 0\); \([-1, 5]\).
51 Skills - graphical solution to Section 1.5 Exercise 91 · Level 2
Use the graphical method to solve the equation in Exercise 91 from Section 1.5.
52 Skills - graphical solution to Section 1.5 Exercise 92 · Level 2
Use the graphical method to solve the equation in Exercise 92 from Section 1.5.
53 Skills - graphical solution to Section 1.5 Exercise 97 · Level 2
Use the graphical method to solve the equation in Exercise 97 from Section 1.5.
54 Skills - graphical solution to Section 1.5 Exercise 98 · Level 2
Use the graphical method to solve the equation in Exercise 98 from Section 1.5.
55 Skills - find all real solutions · Level 3
Find all real solutions of the equation, rounded to two decimals: \(x^3 - 2 x^2 - x - 1 = 0\).
56 Skills - find all real solutions · Level 3
Find all real solutions of the equation, rounded to two decimals: \(x^4 - 8 x^2 + 2 = 0\).
57 Skills - find all real solutions · Level 3
Find all real solutions of the equation, rounded to two decimals: \(x (x - 1)(x + 2) = \dfrac{1}{6} x\).
58 Skills - find all real solutions · Level 3
Find all real solutions of the equation, rounded to two decimals: \(x^4 = 16 - x^3\).
59 Skills - solve inequality graphically · Level 1
Find the solutions of the inequality by drawing appropriate graphs. State each answer rounded to two decimals. \(x^2 \leq 3 x + 10\).
60 Skills - solve inequality graphically · Level 2
Find the solutions of the inequality by drawing appropriate graphs. State each answer rounded to two decimals. \(0.5 x^2 + 0.875 x \leq 0.25\).
61 Skills - solve inequality graphically · Level 2
Find the solutions of the inequality by drawing appropriate graphs. State each answer rounded to two decimals. \(x^3 + 11 x \leq 6 x^2 + 6\).
62 Skills - solve inequality graphically · Level 3
Find the solutions of the inequality by drawing appropriate graphs. State each answer rounded to two decimals. \(16 x^3 + 24 x^2 > -9 x - 1\).
63 Skills - solve inequality graphically · Level 3
Find the solutions of the inequality by drawing appropriate graphs. State each answer rounded to two decimals. \(x^{\dfrac{1}{3}} < x\).
64 Skills - solve inequality graphically · Level 3
Find the solutions of the inequality by drawing appropriate graphs. State each answer rounded to two decimals. \(\sqrt{0.5 x^2 + 1} \leq 2 |x|\).
65 Skills - solve inequality graphically · Level 2
Find the solutions of the inequality by drawing appropriate graphs. State each answer rounded to two decimals. \((x + 1)^2 < (x - 1)^2\).
66 Skills - solve inequality graphically · Level 3
Find the solutions of the inequality by drawing appropriate graphs. State each answer rounded to two decimals. \((x + 1)^2 \leq x^3\).
67 Skills - graphical solution to Section 1.7 Exercise 43 · Level 2
Use the graphical method to solve the inequality in Exercise 43 from Section 1.7.
68 Skills - graphical solution to Section 1.7 Exercise 44 · Level 2
Use the graphical method to solve the inequality in Exercise 44 from Section 1.7.
69 Skills - graphical solution to Section 1.7 Exercise 53 · Level 2
Use the graphical method to solve the inequality in Exercise 53 from Section 1.7.
70 Skills - graphical solution to Section 1.7 Exercise 54 · Level 2
Use the graphical method to solve the inequality in Exercise 54 from Section 1.7.
71 Skills - find remaining solutions of Example 6 · Level 3
In Example 6 we found two solutions of the equation \(x^3 - 6 x^2 + 9 x = \sqrt{x}\), the solutions that lie between 1 and 6. Find two more solutions, correct to two decimals.
72 Applications - profit estimation · Level 3
Estimating Profit. An appliance manufacturer estimates that the profit \(y\) (in dollars) generated by producing \(x\) cooktops per month is given by the equation \(y = 10 x + 0.5 x^2 - 0.001 x^3 - 5000\) where \(0 \leq x \leq 450\).
(a) Graph the equation.
(b) How many cooktops must be produced to begin generating a profit?
(c) For what range of values of \(x\) is the company's profit greater than \$15{,}000?

Enter your answer directly below each part above.

73 Applications - distance to the horizon · Level 3
How Far Can You See? If you stand on a ship in a calm sea, then your height \(x\) (in ft) above sea level is related to the farthest distance \(y\) (in mi) that you can see by the equation \(y = \sqrt{1.5 x + \left(\dfrac{x}{5280}\right)^2}\).
question image
(a) Graph the equation for \(0 \leq x \leq 100\).
(b) How high up do you have to be to be able to see 10 mi?

Enter your answer directly below each part above.

74 Discovery / Discussion / Writing · Level 2
Misleading Graphs. Write a short essay describing different ways in which a graphing calculator might give a misleading graph of an equation.
75 Discovery / Discussion / Writing · Level 2
Algebraic and Graphical Solution Methods. Write a short essay comparing the algebraic and graphical methods for solving equations. Make up your own examples to illustrate the advantages and disadvantages of each method.
76 Discovery / Discussion / Writing · Level 2
Equation Notation on Graphing Calculators. When you enter the following equations into your calculator, how does what you see on the screen differ from the usual way of writing the equations? (Check your user's manual if you're not sure.)
(a) \(y = |x|\)
(b) \(y = \sqrt[5]{x}\)
(c) \(y = x/(x - 1)\)
(d) \(y = x^3 + \sqrt[3]{x + 2}\)

Enter your answer directly below each part above.

77 Discovery / Discussion / Writing · Level 2
Enter Equations Carefully. A student wishes to graph the equations \(y = x^{\dfrac{1}{3}}\) and \(y = x/(x + 4)\) on the same screen, so he enters the following information into his calculator: \(Y_1 = X^1/3\) and \(Y_2 = \dfrac{X}{X} + 4\). The calculator graphs two lines instead of the equations he wanted. What went wrong?
78 Example - Choosing an Appropriate Viewing Rectangle · Level 2
Graph the equation \(y = x^2 + 3\) in an appropriate viewing rectangle.
question image
79 Example - Two Graphs on the Same Screen · Level 2
Graph the equations \(y = 3 x^2 - 6 x + 1\) and \(y = 0.23 x - 2.25\) together in the viewing rectangle \([-1, 3]\) by \([-2.5, 1.5]\). Do the graphs intersect in this viewing rectangle?
question image
80 Example - Graphing a Circle · Level 2
Graph the circle \(x^2 + y^2 = 1\).
question image
81 Example - Solving a Quadratic Equation Algebraically and Graphically · Level 3
Solve the quadratic equations algebraically and graphically.
question image
(a) \(x^2 - 4 x + 2 = 0\)
(b) \(x^2 - 4 x + 4 = 0\)
(c) \(x^2 - 4 x + 6 = 0\)

Enter your answer directly below each part above.

82 Example - Graphical method for linear equation · Level 2
Solve the equation algebraically and graphically: \(5 - 3 x = 8 x - 20\).
question image
83 Example - Equation on a restricted interval · Level 3
Solve the equation \(x^3 - 6 x^2 + 9 x = \sqrt{x}\) in the interval \([1, 6]\).
question image
84 Example - Intensity of light (modeling) · Level 3
Two light sources are 10 m apart. One is three times as intense as the other. The light intensity \(L\) (in lux) at a point \(x\) meters from the weaker source is given by \(L = 10/x^2 + 30/(10 - x)^2\). Find the points at which the light intensity is 4 lux.
question image
85 Example - Solving a quadratic inequality graphically · Level 3
Solve the inequality \(3.7 x^2 + 1.3 x - 1.9 \leq 2.0 - 1.4 x\).
question image
86 Example - Solving a cubic inequality graphically · Level 3
Solve the inequality \(x^3 - 5 x^2 \geq -8\).
question image

Answered: 0 / 86