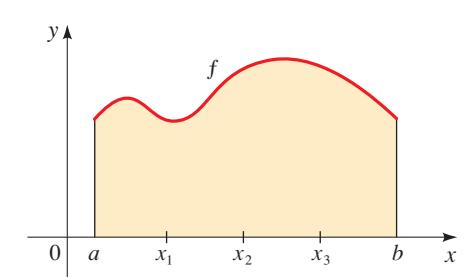
The graph of a function \(f\) is shown. To find the area under the graph of \(f\), we first approximate the area by ___. Approximate the area by drawing four rectangles. The area \(R_4\) of this approximation is ___
Click to select photo
2
Concept - Exact Area
· Level 1
Select error type
selected
Let \(R_n\) be the approximation obtained by using \(n\) rectangles of equal width. The exact area under the graph of \(f\) is ___
Click to select photo
3
Skills - Lower and Upper Estimates
· Level 2
Select error type
selected
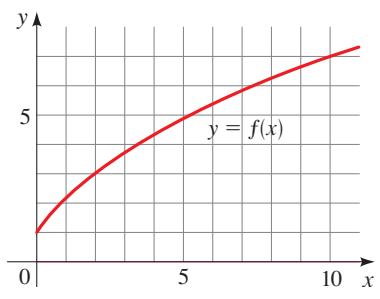
(a) By reading values from the given graph of \(f\), use five rectangles to find a lower estimate and an upper estimate for the area under the given graph of \(f\) from \(x = 0\) to \(x = 10\). In each case, sketch the rectangles that you use.
(b) Find new estimates using ten rectangles in each case.
Enter your answer directly below each part above.
Click to select photo
4
Skills - Left and Right Endpoint Approximations
· Level 2
Select error type
selected
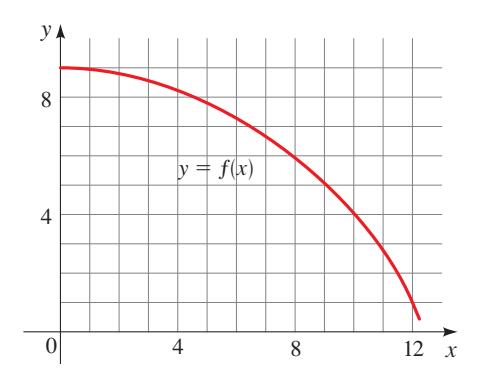
(a) Use six rectangles to find estimates of each type for the area under the given graph of \(f\) from \(x = 0\) to \(x = 12\).
(i) \(L_6\) (using left endpoints)
(ii) \(R_6\) (using right endpoints)
(b) Is \(L_6\) an underestimate or an overestimate of the true area?
(c) Is \(R_6\) an underestimate or an overestimate of the true area?
Enter your answer directly below each part above.
Click to select photo
5
Skills - Approximating Area
· Level 2
Select error type
selected
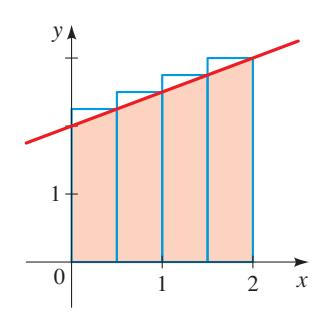
Use the graph to estimate the area under the graph of \(f(x) = \left(\dfrac{1}{2}\right) x + 2\) over the indicated interval.
Click to select photo
6
Skills - Approximating Area
· Level 2
Select error type
selected
Use the graph to estimate the area under the graph of \(f(x) = 4 - x^2\) over the indicated interval.
Click to select photo
7
Skills - Approximating Area
· Level 2
Select error type
selected
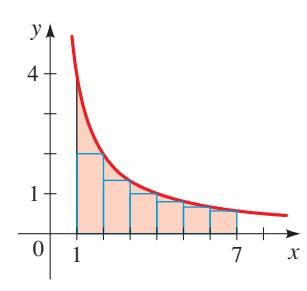
Use the graph to estimate the area under the graph of \(f(x) = \dfrac{4}{x}\) over the indicated interval.
Click to select photo
8
Skills - Approximating Area
· Level 2
Select error type
selected
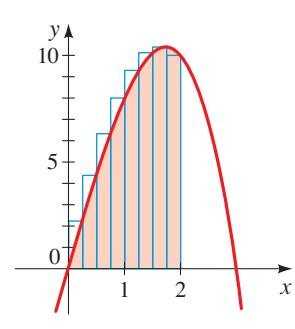
Use the graph to estimate the area under the graph of \(f(x) = 9 x - x^3\) over the indicated interval.
Click to select photo
9
Skills - Rectangle Approximations
· Level 2
Select error type
selected
(a) Estimate the area under the graph of \(f(x) = \dfrac{1}{x}\) from \(x = 1\) to \(x = 5\) using four approximating rectangles and right endpoints. Sketch the graph and the rectangles. Is your estimate an underestimate or an overestimate?
(b) Repeat part (a), using left endpoints.
Enter your answer directly below each part above.
Click to select photo
10
Skills - Rectangle Approximations
· Level 2
Select error type
selected
(a) Estimate the area under the graph of \(f(x) = 25 - x^2\) from \(x = 0\) to \(x = 5\) using five approximating rectangles and right endpoints. Sketch the graph and the rectangles. Is your estimate an underestimate or an overestimate?
(b) Repeat part (a) using left endpoints.
Enter your answer directly below each part above.
Click to select photo
11
Skills - Rectangle Approximations
· Level 2
Select error type
selected
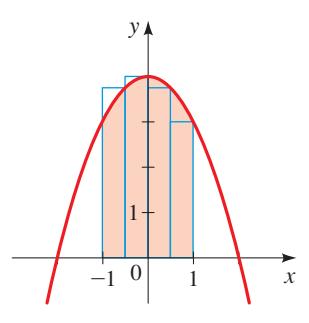
(a) Estimate the area under the graph of \(f(x) = 1 + x^2\) from \(x = -1\) to \(x = 2\) using three rectangles and right endpoints. Then improve your estimate by using six rectangles. Sketch the curve and the approximating rectangles.
(b) Repeat part (a) using left endpoints.
Enter your answer directly below each part above.
Click to select photo
12
Skills - Rectangle Approximations
· Level 3
Select error type
selected
(a) Estimate the area under the graph of \(f(x) = e^{-x}\), \(0 \leq x \leq 4\), using four approximating rectangles and taking the sample points to be
(i) right endpoints
(ii) left endpoints
In each case, sketch the curve and the rectangles.
(b) Improve your estimates in part (a) by using eight rectangles.
Enter your answer directly below each part above.
Click to select photo
13
Skills - Area as Limit
· Level 3
Select error type
selected
Use the definition of area as a limit to find the area of the region that lies under the curve. Check your answer by sketching the region and using geometry.
\(y = 3 x\), \(0 \leq x \leq 5\)
Click to select photo
14
Skills - Area as Limit
· Level 3
Select error type
selected
Use the definition of area as a limit to find the area of the region that lies under the curve. Check your answer by sketching the region and using geometry.
\(y = 2 x + 1\), \(1 \leq x \leq 3\)
Click to select photo
15
Skills - Area Under Curve
· Level 3
Select error type
selected
Find the area of the region that lies under the graph of \(f\) over the given interval.
\(f(x) = 3 x^2\), \(0 \leq x \leq 2\)
Click to select photo
16
Skills - Area Under Curve
· Level 3
Select error type
selected
Find the area of the region that lies under the graph of \(f\) over the given interval.
\(f(x) = x + x^2\), \(0 \leq x \leq 1\)
Click to select photo
17
Skills - Area Under Curve
· Level 3
Select error type
selected
Find the area of the region that lies under the graph of \(f\) over the given interval.
\(f(x) = x^3 + 2\), \(0 \leq x \leq 5\)
Click to select photo
18
Skills - Area Under Curve
· Level 3
Select error type
selected
Find the area of the region that lies under the graph of \(f\) over the given interval.
\(f(x) = 4 x^3\), \(2 \leq x \leq 5\)
Click to select photo
19
Skills - Area Under Curve
· Level 3
Select error type
selected
Find the area of the region that lies under the graph of \(f\) over the given interval.
\(f(x) = x + 6 x^2\), \(1 \leq x \leq 4\)
Click to select photo
20
Skills - Area Under Curve
· Level 3
Select error type
selected
Find the area of the region that lies under the graph of \(f\) over the given interval.
\(f(x) = 20 - 2 x^2\), \(2 \leq x \leq 3\)
Click to select photo
21
Discovery - Calculator Area Program
· Level 2
Select error type
selected
Approximating Area with a Calculator. When we approximate areas using rectangles, the more rectangles we use, the more accurate the answer. The following TI-83 program finds the approximate area under the graph of \(f\) on the interval \([a, b]\) using \(n\) rectangles. To use the program, first store the function \(f\) in \(Y_1\). The program prompts you to enter N, the number of rectangles, and A and B, the endpoints of the interval.
(a) Approximate the area under the graph of \(f(x) = x^5 + 2 x + 3\) on \([1, 3]\), using 10, 20, and 100 rectangles.
(b) Approximate the area under the graph of \(f\) on the given interval, using 100 rectangles.
(i) \(f(x) = \sin x\), on \([0, \pi]\)
(ii) \(f(x) = e^{-x^2}\), on \([-1, 1]\)
PROGRAM: AREA
:Prompt N
:Prompt A
:Prompt B
:(B-A)/N -> D
:0 -> S
:A -> X
:For (K,1,N)
:X+D -> X
:S+Y_1 -> S
:End
:D*S -> S
:Disp "AREA IS"
:Disp S
Enter your answer directly below each part above.
Click to select photo
22
Discovery - Polygons vs Curved Boundaries
· Level 1
Select error type
selected
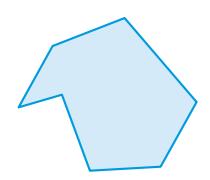
Regions with Straight Versus Curved Boundaries. Write a short essay that explains how you would find the area of a polygon, that is, a region bounded by straight line segments. Then explain how you would find the area of a region whose boundary is curved, as we did in this section. What is the fundamental difference between these two processes?
Click to select photo
23
Example - Estimating Area with Rectangles
· Level 3
Select error type
selected
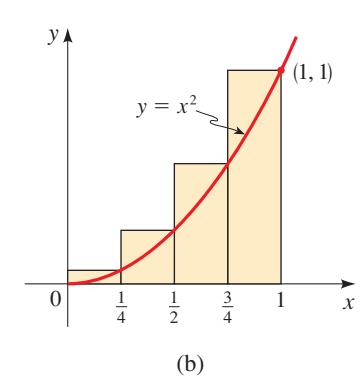
Use rectangles to estimate the area under the parabola \(y = x^2\) from \(0\) to \(1\) (the parabolic region \(S\) illustrated in Figure 3).
Click to select photo
24
Example - The Limit of Approximating Sums
· Level 3
Select error type
selected
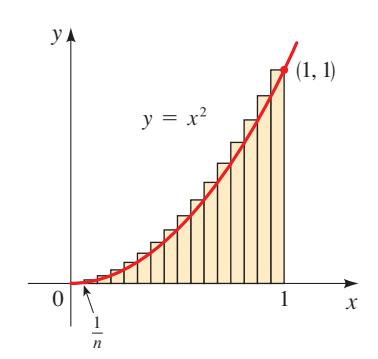
For the region \(S\) in Example 1 (under \(y = x^2\) on \([0, 1]\)), show that the sum of the areas of the upper approximating rectangles approaches \(\dfrac{1}{3}\), that is, \(\operatorname*{lim}\limits_{n\rightarrow \infty} R_n = \dfrac{1}{3}\).
Click to select photo
25
Example - Finding the Area Under a Curve
· Level 3
Select error type
selected
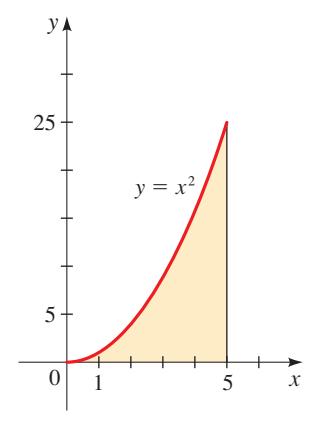
Find the area of the region that lies under the parabola \(y = x^2\), \(0 \leq x \leq 5\).
Click to select photo
26
Example - Finding the Area Under a Curve
· Level 3
Select error type
selected
Find the area of the region that lies under the parabola \(y = 4 x - x^2\), \(1 \leq x \leq 3\).