Stewart Precalc 6e Section 10.9: Systems of Inequalities

20 questions

--:--
0 / 20
Stewart Precalc 6e Section 10.9: Systems of Inequalities 0/20
1 Concepts - Graphing Inequalities · Level 1
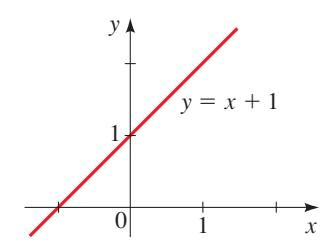
To graph an inequality, we first graph the corresponding _____. So to graph \(y \leq x + 1\), we first graph the equation _____. To decide which side of the graph of the equation is the graph of the inequality, we use _____ points. Using \((0, 0)\) as such a point, graph the inequality by shading the appropriate region.
question image
2 Concepts - Systems of Inequalities · Level 1
Shade the solution of each system of inequalities on the given graph. *(a)* \( \begin{cases} x - y \geq 0 \\ x + y \geq 2 \end{cases} \) *(b)* \( \begin{cases} x - y \leq 0 \\ x + y \leq 2 \end{cases} \) *(c)* \( \begin{cases} x - y \geq 0 \\ x + y \leq 2 \end{cases} \)
question image
3 Skills - Graph the inequality · Level 1
\( y \geq -2 \)
4 Skills - Graph the inequality · Level 1
\( y > x \)
5 Skills - Graph the inequality · Level 1
\( y < x + 2 \)
6 Skills - Graph the inequality · Level 1
\( y \leq 2x + 2 \)
7 Skills - Graph the inequality · Level 1
\( y < -x + 5 \)
8 Skills - Graph the inequality · Level 2
\( 2x - y \leq 8 \)
9 Skills - Graph the inequality · Level 2
\( 3x + 4y + 12 > 0 \)
10 Skills - Graph the inequality · Level 2
\( 4x + 5y < 20 \)
11 Skills - Graph the inequality · Level 2
\( -x^2 + y \geq 10 \)
12 Skills - Graph the inequality · Level 2
\( y > x^2 + 1 \)
13 Skills - Graph the inequality · Level 2
\( x^2 + y^2 \geq 9 \)
14 Skills - Graph the inequality · Level 2
\( x^2 + y^2 \leq 25 \)
15 Skills - Graph the inequality · Level 2
\( x^2 + (y - 1)^2 \leq 1 \)
16 Example - Graphs of Inequalities · Level 2
Graph each inequality. *(a)* \(x^2 + y^2 < 25\) *(b)* \(x + 2y \geq 5\)
question image
17 Example - System of Two Inequalities · Level 3
Graph the solution of the system of inequalities, and label its vertices. \( \begin{cases} x^2 + y^2 < 25 \\ x + 2y \geq 5 \end{cases} \)
question image
18 Example - System of Four Linear Inequalities · Level 3
Graph the solution set of the system, and label its vertices. \( \begin{cases} x + 3y \leq 12 \\ x + y \leq 8 \\ x \geq 0 \\ y \geq 0 \end{cases} \)
question image
19 Example - System of Linear Inequalities · Level 3
Graph the solution set of the system. \( \begin{cases} x + 2y \geq 8 \\ -x + 2y \leq 4 \\ 3x - 2y \leq 8 \end{cases} \)
question image
20 Example - Application: Feasible Regions · Level 3
A factory produces two agricultural pesticides, A and B. For every barrel of A, the factory emits \(0.25\) kg of carbon monoxide (CO) and \(0.60\) kg of sulfur dioxide; for every barrel of B, it emits \(0.50\) kg of CO and \(0.20\) kg of sulfur dioxide. Pollution laws restrict the factory's output of CO to a maximum of \(75\) kg and sulfur dioxide to a maximum of \(90\) kg per day. *(a)* Find a system of inequalities that describes the number of barrels of each pesticide the factory can produce and still satisfy the pollution laws. Graph the feasible region. *(b)* Would it be legal for the factory to produce \(100\) barrels of A and \(80\) barrels of B per day? *(c)* Would it be legal for the factory to produce \(60\) barrels of A and \(160\) barrels of B per day?
question image

Answered: 0 / 20