Stewart Precalc 6e Section 4.6: Modeling with Exponential and Logarithmic Functions

54 questions

--:--
0 / 54
Stewart Precalc 6e Section 4.6: Modeling with Exponential and Logarithmic Functions 0/54
1 Exercise - Bacteria Culture · Level 2
A certain culture of the bacterium *Streptococcus A* initially has 10 bacteria and is observed to double every 1.5 hours. *(a)* Find an exponential model \(n(t) = n_0 \cdot 2^{\dfrac{t}{a}}\) for the number of bacteria in the culture after \(t\) hours. *
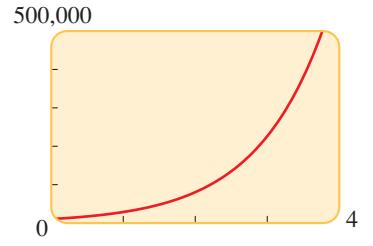
(b)* Estimate the number of bacteria after 35 hours. *(c)* When will the bacteria count reach 10,000?
question image
2 Exercise - Bacteria Culture · Level 2
A certain culture of the bacterium *Rhodobacter sphaeroides* initially has 25 bacteria and is observed to double every 5 hours. *(a)* Find an exponential model \(n(t) = n_0 \cdot 2^{\dfrac{t}{a}}\) for the number of bacteria in the culture after \(t\) hours. *(b)* Estimate the number of bacteria after 18 hours. *(c)* After how many hours will the bacteria count reach 1 million?
3 Exercise - Squirrel Population · Level 2
A grey squirrel population was introduced in a certain county of Great Britain 30 years ago. Biologists observe that the population doubles every 6 years, and now the population is 100,000. *(a)* What was the initial size of the squirrel population? *(b)* Estimate the squirrel population 10 years from now. *(c)* Sketch a graph of the squirrel population.
4 Exercise - Bird Population · Level 2
A certain species of bird was introduced in a certain county 25 years ago. Biologists observe that the population doubles every 10 years, and now the population is 13,000. *(a)* What was the initial size of the bird population? *(b)* Estimate the bird population 5 years from now. *(c)* Sketch a graph of the bird population.
5 Exercise - Fox Population · Level 2
The fox population in a certain region has a relative growth rate of 8% per year. It is estimated that the population in 2005 was 18,000. *(a)* Find a function \(n(t) = n_0 e^{r t}\) that models the population \(t\) years after 2005. *(b)* Use the function from part (a) to estimate the fox population in the year 2013. *(c)* Sketch a graph of the fox population function for the years 2005–2013.
6 Exercise - Fish Population · Level 2
The population of a certain species of fish has a relative growth rate of 1.2% per year. It is estimated that the population in 2000 was 12 million. *(a)* Find an exponential model \(n(t) = n_0 e^{r t}\) for the population \(t\) years after 2000. *(b)* Estimate the fish population in the year 2005. *(c)* Sketch a graph of the fish population.
7 Population Growth · Level 2
Population of a Country. The population of a country has a relative growth rate of 3% per year. The government is trying to reduce the growth rate to 2%. The population in 1995 was approximately 110 million. Find the projected population for the year 2020 for the following conditions.
(a) The relative growth rate remains at 3% per year.
(b) The relative growth rate is reduced to 2% per year.

Enter your answer directly below each part above.

8 Bacteria Growth · Level 2
Bacteria Culture. It is observed that a certain bacteria culture has a relative growth rate of 12% per hour, but in the presence of an antibiotic the relative growth rate is reduced to 5% per hour. The initial number of bacteria in the culture is 22. Find the projected population after 24 hours for the following conditions.
(a) No antibiotic is present, so the relative growth rate is 12%.
(b) An antibiotic is present in the culture, so the relative growth rate is reduced to 5%.

Enter your answer directly below each part above.

9 Doubling Time · Level 2
Population of a City. The population of a certain city was 112,000 in 2006, and the observed doubling time for the population is 18 years.
(a) Find an exponential model \(n(t) = n_0 \cdot 2^{\dfrac{t}{a}}\) for the population \(t\) years after 2006.
(b) Find an exponential model \(n(t) = n_0 e^{r t}\) for the population \(t\) years after 2006.
(c) Sketch a graph of the population at time \(t\).
(d) Estimate when the population will reach 500,000.

Enter your answer directly below each part above.

10 Doubling Time · Level 2
Bat Population. The bat population in a certain Midwestern county was 350,000 in 2009, and the observed doubling time for the population is 25 years.
(a) Find an exponential model \(n(t) = n_0 \cdot 2^{\dfrac{t}{a}}\) for the population \(t\) years after 2006.
(b) Find an exponential model \(n(t) = n_0 e^{r t}\) for the population \(t\) years after 2006.
(c) Sketch a graph of the population at time \(t\).
(d) Estimate when the population will reach 2 million.

Enter your answer directly below each part above.

11 Population Growth from Graph · Level 3
Deer Population. The graph shows the deer population in a Pennsylvania county between 2003 and 2007. Assume that the population grows exponentially.
question image
(a) What was the deer population in 2003?
(b) Find a function that models the deer population \(t\) years after 2003.
(c) What is the projected deer population in 2011?
(d) In what year will the deer population reach 100,000?

Enter your answer directly below each part above.

12 Population Growth from Graph · Level 3
Frog Population. Some bullfrogs were introduced into a small pond. The graph shows the bullfrog population for the next few years. Assume that the population grows exponentially.
question image
(a) What was the initial bullfrog population?
(b) Find a function that models the bullfrog population \(t\) years since the bullfrogs were put into the pond.
(c) What is the projected bullfrog population after 15 years?
(d) Estimate how long it takes the population to reach 75,000.

Enter your answer directly below each part above.

13 Bacteria Growth · Level 2
Bacteria Culture. A culture starts with 8600 bacteria. After one hour the count is 10,000.
(a) Find a function that models the number of bacteria \(n(t)\) after \(t\) hours.
(b) Find the number of bacteria after 2 hours.
(c) After how many hours will the number of bacteria double?

Enter your answer directly below each part above.

14 Bacteria Growth · Level 3
Bacteria Culture. The count in a culture of bacteria was 400 after 2 hours and 25,600 after 6 hours.
(a) What is the relative rate of growth of the bacteria population? Express your answer as a percentage.
(b) What was the initial size of the culture?
(c) Find a function that models the number of bacteria \(n(t)\) after \(t\) hours.
(d) Find the number of bacteria after 4.5 hours.
(e) When will the number of bacteria be 50,000?

Enter your answer directly below each part above.

15 Population Growth · Level 3
Population of California. The population of California was 29.76 million in 1990 and 33.87 million in 2000. Assume that the population grows exponentially.
(a) Find a function that models the population \(t\) years after 1990.
(b) Find the time required for the population to double.
(c) Use the function from part (a) to predict the population of California in the year 2010. Look up California's actual population in 2010, and compare.

Enter your answer directly below each part above.

16 Population Growth · Level 2
World Population. The population of the world was 5.7 billion in 1995, and the observed relative growth rate was 2% per year.
(a) By what year will the population have doubled?
(b) By what year will the population have tripled?

Enter your answer directly below each part above.

17 Radioactive Decay · Level 2
Radioactive Radium. The half-life of radium-226 is 1600 years. Suppose we have a 22-mg sample.
(a) Find a function \(m(t) = m_0 \cdot 2^{-\dfrac{t}{h}}\) that models the mass remaining after \(t\) years.
(b) Find a function \(m(t) = m_0 e^{-r t}\) that models the mass remaining after \(t\) years.
(c) How much of the sample will remain after 4000 years?
(d) After how long will only 18 mg of the sample remain?

Enter your answer directly below each part above.

18 Radioactive Decay · Level 2
Radioactive Cesium. The half-life of cesium-137 is 30 years. Suppose we have a 10-g sample.
(a) Find a function \(m(t) = m_0 \cdot 2^{-\dfrac{t}{h}}\) that models the mass remaining after \(t\) years.
(b) Find a function \(m(t) = m_0 e^{-r t}\) that models the mass remaining after \(t\) years.
(c) How much of the sample will remain after 80 years?
(d) After how long will only 2 g of the sample remain?

Enter your answer directly below each part above.

19 Radioactive Decay · Level 2
Radioactive Strontium. The half-life of strontium-90 is 28 years. How long will it take a 50-mg sample to decay to a mass of 32 mg?
20 Radioactive Decay · Level 2
Radioactive Radium. Radium-221 has a half-life of 30 s. How long will it take for 95% of a sample to decay?
21 Radioactive Decay · Level 2
Finding Half-life. If 250 mg of a radioactive element decays to 200 mg in 48 hours, find the half-life of the element.
22 Radioactive Decay · Level 2
Radioactive Radon. After 3 days a sample of radon-222 has decayed to 58% of its original amount.
(a) What is the half-life of radon-222?
(b) How long will it take the sample to decay to 20% of its original amount?

Enter your answer directly below each part above.

23 Carbon-14 Dating · Level 2
Carbon-14 Dating. A wooden artifact from an ancient tomb contains 65% of the carbon-14 that is present in living trees. How long ago was the artifact made? (The half-life of carbon-14 is 5730 years.)
24 Carbon-14 Dating · Level 2
Carbon-14 Dating. The burial cloth of an Egyptian mummy is estimated to contain 59% of the carbon-14 it contained originally. How long ago was the mummy buried? (The half-life of carbon-14 is 5730 years.)
question image
25 Newton's Law of Cooling · Level 2
Cooling Soup. A hot bowl of soup is served at a dinner party. It starts to cool according to Newton's Law of Cooling, so its temperature at time \(t\) is given by \(T(t) = 65 + 145 e^{-0.05 t}\) where \(t\) is measured in minutes and \(T\) is measured in degrees F.
(a) What is the initial temperature of the soup?
(b) What is the temperature after 10 min?
(c) After how long will the temperature be 100 degrees F?

Enter your answer directly below each part above.

26 Newton's Law of Cooling · Level 3
Time of Death. Newton's Law of Cooling is used in homicide investigations to determine the time of death. The normal body temperature is 98.6 degrees F. Immediately following death, the body begins to cool. It has been determined experimentally that the constant in Newton's Law of Cooling is approximately \(k = 0.1947\), assuming that time is measured in hours. Suppose that the temperature of the surroundings is 60 degrees F.
(a) Find a function \(T(t)\) that models the temperature \(t\) hours after death.
(b) If the temperature of the body is now 72 degrees F, how long ago was the time of death?

Enter your answer directly below each part above.

27 Newton's Law of Cooling · Level 3
Cooling Turkey. A roasted turkey is taken from an oven when its temperature has reached 185 degrees F and is placed on a table in a room where the temperature is 75 degrees F.
(a) If the temperature of the turkey is 150 degrees F after half an hour, what is its temperature after 45 min?
(b) When will the turkey cool to 100 degrees F?

Enter your answer directly below each part above.

28 Newton's Law of Cooling · Level 3
Boiling Water. A kettle full of water is brought to a boil in a room with temperature 20 degrees C. After 15 min the temperature of the water has decreased from 100 degrees C to 75 degrees C. Find the temperature after another 10 min. Illustrate by graphing the temperature function.
29 pH Scale · Level 1
Finding pH. The hydrogen ion concentration of a sample of each substance is given. Calculate the pH of the substance.
(a) Lemon juice: \([H^+] = 5.0 \times 10^{-3}\) M
(b) Tomato juice: \([H^+] = 3.2 \times 10^{-4}\) M
(c) Seawater: \([H^+] = 5.0 \times 10^{-9}\) M

Enter your answer directly below each part above.

30 pH Scale · Level 1
Finding pH. An unknown substance has a hydrogen ion concentration of \([H^+] = 3.1 \times 10^{-8}\) M. Find the pH and classify the substance as acidic or basic.
31 pH Scale · Level 1
Ion Concentration. The pH reading of a sample of each substance is given. Calculate the hydrogen ion concentration of the substance.
(a) Vinegar: pH = 3.0
(b) Milk: pH = 6.5

Enter your answer directly below each part above.

32 pH Scale · Level 1
Ion Concentration. The pH reading of a glass of liquid is given. Find the hydrogen ion concentration of the liquid.
(a) Beer: pH = 4.6
(b) Water: pH = 7.3

Enter your answer directly below each part above.

33 pH Scale · Level 2
Finding pH. The hydrogen ion concentrations in cheeses range from \(4.0 \times 10^{-7}\) M to \(1.6 \times 10^{-5}\) M. Find the corresponding range of pH readings.
question image
34 pH Scale · Level 2
Ion Concentration in Wine. The pH readings for wines vary from 2.8 to 3.8. Find the corresponding range of hydrogen ion concentrations.
35 Richter Scale · Level 2
Earthquake Magnitudes. If one earthquake is 20 times as intense as another, how much larger is its magnitude on the Richter scale?
36 Richter Scale · Level 2
Earthquake Magnitudes. The 1906 earthquake in San Francisco had a magnitude of 8.3 on the Richter scale. At the same time in Japan an earthquake with magnitude 4.9 caused only minor damage. How many times more intense was the San Francisco earthquake than the Japanese earthquake?
37 Richter Scale · Level 2
Earthquake Magnitudes. The Alaska earthquake of 1964 had a magnitude of 8.6 on the Richter scale. How many times more intense was this than the 1906 San Francisco earthquake? (See Exercise 36.)
38 Richter Scale · Level 2
Earthquake Magnitudes. The Northridge, California, earthquake of 1994 had a magnitude of 6.8 on the Richter scale. A year later, a 7.2-magnitude earthquake struck Kobe, Japan. How many times more intense was the Kobe earthquake than the Northridge earthquake?
39 Richter Scale · Level 2
Earthquake Magnitudes. The 1985 Mexico City earthquake had a magnitude of 8.1 on the Richter scale. The 1976 earthquake in Tangshan, China, was 1.26 times as intense. What was the magnitude of the Tangshan earthquake?
40 Decibel Scale · Level 2
Subway Noise. The intensity of the sound of a subway train was measured at 98 dB. Find the intensity in \(W slash m^2\).
41 Decibel Scale · Level 2
Traffic Noise. The intensity of the sound of traffic at a busy intersection was measured at \(2.0 \times 10^{-5} W slash m^2\). Find the intensity level in decibels.
42 Decibel Scale · Level 2
Comparing Decibel Levels. The noise from a power mower was measured at 106 dB. The noise level at a rock concert was measured at 120 dB. Find the ratio of the intensity of the rock music to that of the power mower.
43 Decibel Scale - Inverse Square Law · Level 3
Inverse Square Law for Sound. A law of physics states that the intensity of sound is inversely proportional to the square of the distance \(d\) from the source: \(I = k / d^2\).
(a) Use this model and the equation \(B = 10 \log\left(\dfrac{I}{I_0}\right)\) (described in this section) to show that the decibel levels \(B_1\) and \(B_2\) at distances \(d_1\) and \(d_2\) from a sound source are related by the equation \(B_2 = B_1 + 20 \log\left(\dfrac{d_1}{d_2}\right)\).
(b) The intensity level at a rock concert is 120 dB at a distance 2 m from the speakers. Find the intensity level at a distance of 10 m.

Enter your answer directly below each part above.

44 Example - Bacteria Population (Doubling Time) · Level 2
Under ideal conditions a certain bacteria population doubles every three hours. Initially there are 1000 bacteria in a colony.
question image
(a) Find a model for the bacteria population after \(t\) hours.
(b) How many bacteria are in the colony after 15 hours?
(c) When will the bacteria count reach 100,000?

Enter your answer directly below each part above.

45 Example - Rabbit Population · Level 3
A certain breed of rabbit was introduced onto a small island 8 months ago. The current rabbit population on the island is estimated to be 4100 and doubling every 3 months.
question image
(a) What was the initial size of the rabbit population?
(b) Estimate the population one year after the rabbits were introduced to the island.
(c) Sketch a graph of the rabbit population.

Enter your answer directly below each part above.

46 Example - Predicting the Size of a Population (Relative Growth Rate) · Level 2
The initial bacterium count in a culture is 500. A biologist later makes a sample count of bacteria in the culture and finds that the relative rate of growth is 40% per hour.
question image
(a) Find a function that models the number of bacteria after \(t\) hours.
(b) What is the estimated count after 10 hours?
(c) When will the bacteria count reach 80,000?
(d) Sketch the graph of the function \(n(t)\).

Enter your answer directly below each part above.

47 Example - Comparing Different Rates of Population Growth · Level 3
In 2000 the population of the world was 6.1 billion, and the relative rate of growth was 1.4% per year. It is claimed that a rate of 1.0% per year would make a significant difference in the total population in just a few decades. Test this claim by estimating the population of the world in the year 2050 using a relative rate of growth of (a) 1.4% per year and (b) 1.0% per year. Graph the population functions for the next 100 years for the two relative growth rates in the same viewing rectangle.
question image
48 Example - Expressing a Model in Terms of e · Level 3
A culture starts with 10,000 bacteria, and the number doubles every 40 minutes.
question image
(a) Find a function \(n(t) = n_0 2^{\dfrac{t}{a}}\) that models the number of bacteria after \(t\) minutes.
(b) Find a function \(n(t) = n_0 e^{r t}\) that models the number of bacteria after \(t\) minutes.
(c) Sketch a graph of the number of bacteria at time \(t\).

Enter your answer directly below each part above.

49 Example - Radioactive Decay (Polonium-210) · Level 3
Polonium-210 (mass number 210) has a half-life of 140 days. Suppose a sample of this substance has a mass of 300 mg.
(a) Find a function \(m(t) = m_0 2^{-\dfrac{t}{h}}\) that models the mass remaining after \(t\) days.
(b) Find a function \(m(t) = m_0 e^{-r t}\) that models the mass remaining after \(t\) days.
(c) Find the mass remaining after one year.
(d) How long will it take for the sample to decay to a mass of 200 mg?
(e) Draw a graph of the sample mass as a function of time.

Enter your answer directly below each part above.

50 Example - Newton's Law of Cooling · Level 2
A cup of coffee has a temperature of 200°F and is placed in a room that has a temperature of 70°F. After 10 min the temperature of the coffee is 150°F. *(a)* Find a function that models the temperature of the coffee at time \(t\). *(b)* Find the temperature of the coffee after 15 min. *(c)* When will the coffee have cooled to 100°F? *(d)* Illustrate by drawing a graph of the temperature function.
question image
51 Example - pH Scale and Hydrogen Ion Concentration · Level 2
*(a)* The hydrogen ion concentration of a sample of human blood was measured to be \([H^+] \approx 3.16 \times 10^{-8}\) M. Find the pH and classify the blood as acidic or basic. *(b)* The most acidic rainfall ever measured occurred in Scotland in 1974; its pH was 2.4. Find the hydrogen ion concentration.
52 Example - Magnitude of Earthquakes · Level 2
The 1906 earthquake in San Francisco had an estimated magnitude of 8.3 on the Richter scale. In the same year a powerful earthquake occurred on the Colombia-Ecuador border that was four times as intense. What was the magnitude of the Colombia-Ecuador earthquake on the Richter scale?
question image
53 Example - Intensity of Earthquakes · Level 2
The 1989 Loma Prieta earthquake that shook San Francisco had a magnitude of 7.1 on the Richter scale. How many times more intense was the 1906 earthquake (magnitude 8.
3) than the 1989 event?
54 Example - Sound Intensity of a Jet Takeoff · Level 1
Find the decibel intensity level of a jet engine during takeoff if the intensity was measured at \(100\) W/m².
question image

Answered: 0 / 54