Stewart Precalc 6e Chapter 2 Test

12 questions

0 / 12
Stewart Precalc 6e Chapter 2 Test 0/12
1 Functions - Graphs and One-to-One · Level 2
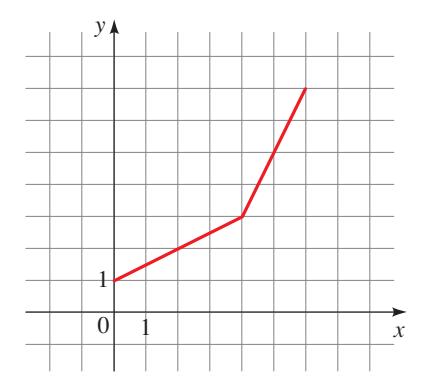
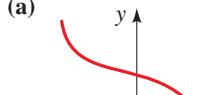
Which of the following are graphs of functions? If the graph is that of a function, is it one-to-one? Four graphs are shown, labeled (a), (b), (c), and (d).
question image
2 Functions - Evaluation and Domain · Level 2
Let \(f(x) = \dfrac{\sqrt{x + 1}}{x}\).
(a) Evaluate \(f(3)\), \(f(5)\), and \(f(a - 1)\).
(b) Find the domain of \(f\).

Enter your answer directly below each part above.

3 Functions - Verbal Description and Inverse · Level 2
A function \(f\) has the following verbal description: "Subtract 2, then cube the result."
(a) Find a formula that expresses \(f\) algebraically.
(b) Make a table of values of \(f\), for the inputs \(-1, 0, 1, 2, 3\), and \(4\).
(c) Sketch a graph of \(f\), using the table of values from part (b) to help you.
(d) How do we know that \(f\) has an inverse? Give a verbal description for \(f^{-1}\).
(e) Find a formula that expresses \(f^{-1}\) algebraically.

Enter your answer directly below each part above.

4 Functions - Quadratic Revenue Modeling · Level 3
A school fund-raising group sells chocolate bars to help finance a swimming pool for their physical education program. The group finds that when they set their price at \(x\) dollars per bar (where \(0 < x \leq 5\)), their total sales revenue (in dollars) is given by the function \(R(x) = -500x^2 + 3000x\).
(a) Evaluate \(R(2)\) and \(R(4)\). What do these values represent?
(b) Use a graphing calculator to draw a graph of \(R\). What does the graph tell us about what happens to revenue as the price increases from \(0\) to \(5\) dollars?
(c) What is the maximum revenue, and at what price is it achieved?

Enter your answer directly below each part above.

5 Functions - Average Rate of Change · Level 2
Determine the average rate of change for the function \(f(t) = t^2 - 2t\) between \(t = 2\) and \(t = 5\).
6 Functions - Graph Transformations · Level 2
(a) Sketch the graph of the function \(f(x) = x^3\).
(b) Use part (a) to graph the function \(g(x) = (x - 1)^3 - 2\).

Enter your answer directly below each part above.

7 Functions - Transformation Effects · Level 2
(a) How is the graph of \(y = f(x - 3) + 2\) obtained from the graph of \(f\)?
(b) How is the graph of \(y = f(-x)\) obtained from the graph of \(f\)?

Enter your answer directly below each part above.

8 Functions - Piecewise · Level 2
Let \(f(x) = \begin{cases} 1 - x & \quad \text{if } x \leq 1 \\ 2x + 1 & \quad \text{if } x > 1 \end{cases}\).
(a) Evaluate \(f(-2)\) and \(f(1)\).
(b) Sketch the graph of \(f\).

Enter your answer directly below each part above.

9 Functions - Composition · Level 3
If \(f(x) = x^2 + 1\) and \(g(x) = x - 3\), find the following:
(a) \(f \circ g\)
(b) \(g \circ f\)
(c) \(f(g(2))\)
(d) \(g(f(2))\)
(e) \(g \circ g \circ g\)

Enter your answer directly below each part above.

10 Functions - Inverse · Level 2
(a) If \(f(x) = 3 - x\), find the inverse function \(f^{-1}\).
(b) Sketch the graphs of \(f\) and \(f^{-1}\) on the same coordinate axes.

Enter your answer directly below each part above.

11 Functions - Reading Graphs (Domain, Range, Inverse, ARC) · Level 2
The graph of a function \(f\) is given.
question image
(a) Find the domain and range of \(f\).
(b) Sketch the graph of \(f^{-1}\).
(c) Find the average rate of change of \(f\) between \(x = 2\) and \(x = 6\).

Enter your answer directly below each part above.

12 Functions - Polynomial Analysis with Graphing Utility · Level 3
Let \(f(x) = 3x^4 - 14x^2 + 5x - 3\).
(a) Draw the graph of \(f\) in an appropriate viewing rectangle.
(b) Is \(f\) one-to-one?
(c) Find the local maximum and minimum values of \(f\) and the values of \(x\) at which they occur. State each answer correct to two decimal places.
(d) Use the graph to determine the range of \(f\).
(e) Find the intervals on which \(f\) is increasing and on which \(f\) is decreasing.

Enter your answer directly below each part above.

Answered: 0 / 12