Stewart Precalc 6e Focus on Modeling: Fitting Polynomial Curves to Data

7 questions

--:--
0 / 7
Stewart Precalc 6e Focus on Modeling: Fitting Polynomial Curves to Data 0/7
1 Polynomial Modeling: Quadratic Fit · Level 3
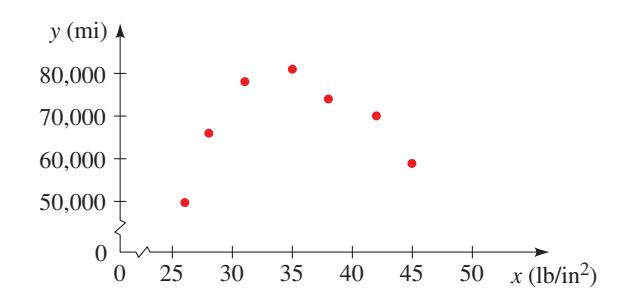
*Tire Inflation and Treadwear.* Car tires need to be inflated properly. Overinflation or underinflation can cause premature treadwear. The data and scatter plot show tire life for different inflation values for a certain type of tire. *(a)* Find the quadratic polynomial that best fits the data. *(b)* Draw a graph of the polynomial from part (a) together with a scatter plot of the data. *(c)* Use your result from part (b) to estimate the pressure that gives the longest tire life.
Pressure (lb/in^2) Tire life (mi)
26 50,000
28 66,000
31 78,000
35 81,000
38 74,000
42 70,000
45 59,000
question image
2 Polynomial Modeling: Quadratic Fit · Level 3
*Too Many Corn Plants per Acre?* The more corn a farmer plants per acre, the greater is the yield the farmer can expect, but only up to a point. Too many plants per acre can cause overcrowding and decrease yields. The data give crop yields per acre for various densities of corn plantings, as found by researchers at a university test farm. *(a)* Find the quadratic polynomial that best fits the data. *(b)* Draw a graph of the polynomial from part (a) together with a scatter plot of the data. *(c)* Use your result from part (b) to estimate the yield for 37,000 plants per acre.
Density (plants/acre) Crop yield (bushels/acre)
15,000 43
20,000 98
25,000 118
30,000 140
35,000 142
40,000 122
45,000 93
50,000 67
question image
3 Polynomial Modeling: Cubic Fit · Level 3
*How Fast Can You List Your Favorite Things?* If you are asked to make a list of objects in a certain category, how fast you can list them follows a predictable pattern. For example, if you try to name as many vegetables as you can, you'll probably think of several right away—for example, carrots, peas, beans, corn, and so on. Then after a pause you might think of ones you eat less frequently—perhaps zucchini, eggplant, and asparagus. Finally, a few more exotic vegetables might come to mind. A psychologist performs this experiment on a number of subjects. The table below gives the average number of vegetables that the subjects named by a given number of seconds. *(a)* Find the cubic polynomial that best fits the data. *(b)* Draw a graph of the polynomial from part (a) together with a scatter plot of the data. *(c)* Use your result from part (b) to estimate the number of vegetables that subjects would be able to name in 40 seconds. *(d)* According to the model, how long (to the nearest 0.1 second) would it take a person to name five vegetables?
Seconds Number of vegetables
1 2
2 6
5 10
10 12
15 14
20 15
25 18
30 21
4 Polynomial Modeling: Quartic Fit · Level 3
*Clothing Sales Are Seasonal.* Clothing sales tend to vary by season, with more clothes sold in spring and fall. The table gives sales figures for each month at a certain clothing store. *(a)* Find the quartic (fourth-degree) polynomial that best fits the data. *(b)* Draw a graph of the polynomial from part (a) together with a scatter plot of the data. *(c)* Do you think that a quartic polynomial is a good model for these data? Explain.
Month Sales (\$)
January 8,000
February 18,000
March 22,000
April 31,000
May 29,000
June 21,000
July 22,000
August 26,000
September 38,000
October 40,000
November 27,000
December 15,000
5 Polynomial Modeling: Quadratic Fit (Projectile Motion) · Level 3
*Height of a Baseball.* A baseball is thrown upward, and its height measured at 0.5-second intervals using a strobe light. The resulting data are given in the table. *(a)* Draw a scatter plot of the data. What degree polynomial is appropriate for modeling the data? *(b)* Find a polynomial model that best fits the data, and graph it on the scatter plot. *(c)* Find the times when the ball is 20 ft above the ground. *(d)* What is the maximum height attained by the ball?
Time (s) Height (ft)
0 4.2
0.5 26.1
1.0 40.1
1.5 46.0
2.0 43.9
2.5 33.7
3.0 15.8
question image
6 Polynomial Modeling: Quadratic Fit · Level 3
A certain tank is filled with water and allowed to drain. The height of the water is measured at different times as shown in the table. *(a)* Find the quadratic polynomial that best fits the data. *(b)* Draw a graph of the polynomial from part (a) together with a scatter plot of the data. *(c)* Use your graph from part (b) to estimate how long it takes for the tank to drain completely.
Time (min) Height (ft)
0 5.0
4 3.1
8 1.9
12 0.8
16 0.2
question image
7 Example - Polynomial Modeling: Cubic Fit · Level 3
*Length-at-Age Data for Fish.* Otoliths ("earstones") are tiny structures that are found in the heads of fish. Microscopic growth rings on the otoliths, not unlike growth rings on a tree, record the age of a fish. The table gives the lengths of rock bass caught at different ages, as determined by the otoliths. Scientists have proposed a cubic polynomial to model this data. *(a)* Use a graphing calculator to find the cubic polynomial of best fit for the data. *(b)* Make a scatter plot of the data and graph the polynomial from part (a). *(c)* A fisherman catches a rock bass 20 in. long. Use the model to estimate its age.
Age (yr) Length (in.) Age (yr) Length (in.)
1 4.8 9 18.2
2 8.8 9 17.1
2 8.0 10 18.8
3 7.9 10 19.5
4 11.9 11 18.9
5 14.4 12 21.7
6 14.1 12 21.9
6 15.8 13 23.8
7 15.6 14 26.9
8 17.8 14 25.1
question image

Answered: 0 / 7