Stewart Precalc 6e Section 2.3: Getting Information from the Graph of a Function

64 questions

--:--
0 / 64
Stewart Precalc 6e Section 2.3: Getting Information from the Graph of a Function 0/64
1 Concept - Reading Function Value from Graph · Level 1
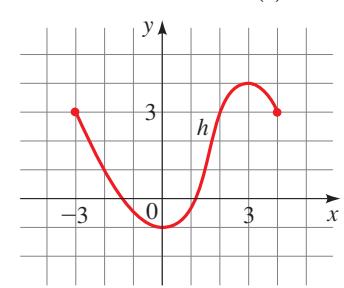
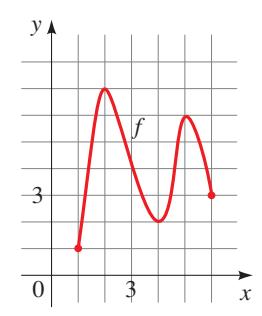
To find a function value \(f(a)\) from the graph of \(f\), we find the height of the graph above the \(x\)-axis at \(x = \)___. From the graph of \(f\) shown, \(f(3) = \)___.
question image
2 Concept - Domain and Range from Graph · Level 1
The domain of the function \(f\) is all the ___-values of the points on the graph, and the range is all the corresponding ___-values. From the graph of \(f\) we see that the domain of \(f\) is the interval ___ and the range of \(f\) is the interval ___.
question image
3 Concept - Increasing and Decreasing Functions · Level 1
question image
(a) If \(f\) is increasing on an interval, then the \(y\)-values of the points on the graph ___ as the \(x\)-values increase. From the graph of \(f\) we see that \(f\) is increasing on the intervals ___ and ___.
(b) If \(f\) is decreasing on an interval, then the \(y\)-values of the points on the graph ___ as the \(x\)-values increase. From the graph of \(f\) we see that \(f\) is decreasing on the intervals ___ and ___.

Enter your answer directly below each part above.

4 Concept - Local Maxima and Minima · Level 1
question image
(a) A function value \(f(a)\) is a local maximum value of \(f\) if \(f(a)\) is the ___ value of \(f\) on some interval containing \(a\). From the graph of \(f\) we see that one local maximum value of \(f\) is ___ and that this value occurs when \(x\) is ___.
(b) The function value \(f(a)\) is a local minimum value of \(f\) if \(f(a)\) is the ___ value of \(f\) on some interval containing \(a\). From the graph of \(f\) we see that one local minimum value of \(f\) is ___ and that this value occurs when \(x\) is ___.

Enter your answer directly below each part above.

5 Skill - Function Values, Domain, Range from Graph · Level 1
The graph of a function \(h\) is given.
question image
(a) Find \(h(-2)\), \(h(0)\), \(h(2)\), and \(h(3)\).
(b) Find the domain and range of \(h\).
(c) Find the values of \(x\) for which \(h(x) = 3\).
(d) Find the values of \(x\) for which \(h(x) \leq 3\).

Enter your answer directly below each part above.

6 Skill - Function Values, Domain, Range from Graph · Level 1
The graph of a function \(g\) is given.
question image
(a) Find \(g(-2)\), \(g(0)\), and \(g(7)\).
(b) Find the domain and range of \(g\).
(c) Find the values of \(x\) for which \(g(x) = 4\).
(d) Find the values of \(x\) for which \(g(x) > 4\).

Enter your answer directly below each part above.

7 Skill - Function Values, Domain, Range from Graph · Level 1
The graph of a function \(g\) is given.
question image
(a) Find \(g(-4)\), \(g(-2)\), \(g(0)\), \(g(2)\), and \(g(4)\).
(b) Find the domain and range of \(g\).

Enter your answer directly below each part above.

8 Skill - Comparing Function Values from Graphs · Level 1
Graphs of the functions \(f\) and \(g\) are given.
question image
(a) Which is larger, \(f(0)\) or \(g(0)\)?
(b) Which is larger, \(f(-3)\) or \(g(-3)\)?
(c) For which values of \(x\) is \(f(x) = g(x)\)?

Enter your answer directly below each part above.

9 Skill - Domain and Range from Function · Level 1
A function \(f\) is given by \(f(x) = x - 1\).
(a) Use a graphing calculator to draw the graph of \(f\).
(b) Find the domain and range of \(f\) from the graph.

Enter your answer directly below each part above.

10 Skill - Domain and Range from Function · Level 1
A function \(f\) is given by \(f(x) = 2(x + 1)\).
(a) Use a graphing calculator to draw the graph of \(f\).
(b) Find the domain and range of \(f\) from the graph.

Enter your answer directly below each part above.

11 Skill - Domain and Range from Function · Level 1
A function \(f\) is given by \(f(x) = 4\), \(1 \leq x \leq 3\).
(a) Use a graphing calculator to draw the graph of \(f\).
(b) Find the domain and range of \(f\) from the graph.

Enter your answer directly below each part above.

12 Skill - Domain and Range from Function · Level 2
A function \(f\) is given by \(f(x) = x^2\), \(-2 \leq x \leq 5\).
(a) Use a graphing calculator to draw the graph of \(f\).
(b) Find the domain and range of \(f\) from the graph.

Enter your answer directly below each part above.

13 Skill - Domain and Range from Function · Level 2
A function \(f\) is given by \(f(x) = 4 - x^2\).
(a) Use a graphing calculator to draw the graph of \(f\).
(b) Find the domain and range of \(f\) from the graph.

Enter your answer directly below each part above.

14 Skill - Domain and Range from Function · Level 2
A function \(f\) is given by \(f(x) = x^2 + 4\).
(a) Use a graphing calculator to draw the graph of \(f\).
(b) Find the domain and range of \(f\) from the graph.

Enter your answer directly below each part above.

15 Skill - Domain and Range from Function · Level 2
A function \(f\) is given by \(f(x) = \sqrt{16 - x^2}\).
(a) Use a graphing calculator to draw the graph of \(f\).
(b) Find the domain and range of \(f\) from the graph.

Enter your answer directly below each part above.

16 Skill - Domain and Range from Function · Level 2
A function \(f\) is given by \(f(x) = -\sqrt{25 - x^2}\).
(a) Use a graphing calculator to draw the graph of \(f\).
(b) Find the domain and range of \(f\) from the graph.

Enter your answer directly below each part above.

17 Skill - Domain and Range from Function · Level 2
A function \(f\) is given by \(f(x) = \sqrt{x - 1}\).
(a) Use a graphing calculator to draw the graph of \(f\).
(b) Find the domain and range of \(f\) from the graph.

Enter your answer directly below each part above.

18 Skill - Domain and Range from Function · Level 2
A function \(f\) is given by \(f(x) = \sqrt{x + 2}\).
(a) Use a graphing calculator to draw the graph of \(f\).
(b) Find the domain and range of \(f\) from the graph.

Enter your answer directly below each part above.

19 Skill - Intervals of Increase and Decrease from Graph · Level 2
The graph of a function is given. Determine the intervals on which the function is (a) increasing and (b) decreasing.
question image
20 Skill - Intervals of Increase and Decrease from Graph · Level 2
The graph of a function is given. Determine the intervals on which the function is (a) increasing and (b) decreasing.
question image
21 Skill - Intervals of Increase and Decrease from Graph · Level 2
The graph of a function is given. Determine the intervals on which the function is (a) increasing and (b) decreasing.
question image
22 Skill - Intervals of Increase and Decrease from Graph · Level 2
The graph of a function is given. Determine the intervals on which the function is (a) increasing and (b) decreasing.
question image
23 Skill - Intervals of Increase and Decrease from Function · Level 2
A function \(f\) is given by \(f(x) = x^2 - 5 x\).
(a) Use a graphing device to draw the graph of \(f\).
(b) State approximately the intervals on which \(f\) is increasing and on which \(f\) is decreasing.

Enter your answer directly below each part above.

24 Skill - Intervals of Increase and Decrease from Function · Level 2
A function \(f\) is given by \(f(x) = x^3 - 4 x\).
(a) Use a graphing device to draw the graph of \(f\).
(b) State approximately the intervals on which \(f\) is increasing and on which \(f\) is decreasing.

Enter your answer directly below each part above.

25 Skill - Intervals of Increase and Decrease from Function · Level 2
A function \(f\) is given by \(f(x) = 2 x^3 - 3 x^2 - 12 x\).
(a) Use a graphing device to draw the graph of \(f\).
(b) State approximately the intervals on which \(f\) is increasing and on which \(f\) is decreasing.

Enter your answer directly below each part above.

26 Skill - Intervals of Increase and Decrease from Function · Level 2
A function \(f\) is given by \(f(x) = x^4 - 16 x^2\).
(a) Use a graphing device to draw the graph of \(f\).
(b) State approximately the intervals on which \(f\) is increasing and on which \(f\) is decreasing.

Enter your answer directly below each part above.

27 Skill - Intervals of Increase and Decrease from Function · Level 2
A function \(f\) is given by \(f(x) = x^3 + 2 x^2 - x - 2\).
(a) Use a graphing device to draw the graph of \(f\).
(b) State approximately the intervals on which \(f\) is increasing and on which \(f\) is decreasing.

Enter your answer directly below each part above.

28 Skill - Intervals of Increase and Decrease from Function · Level 3
A function \(f\) is given by \(f(x) = x^4 - 4 x^3 + 2 x^2 + 4 x - 3\).
(a) Use a graphing device to draw the graph of \(f\).
(b) State approximately the intervals on which \(f\) is increasing and on which \(f\) is decreasing.

Enter your answer directly below each part above.

29 Skill - Intervals of Increase and Decrease from Function · Level 2
A function \(f\) is given by \(f(x) = x^{\dfrac{2}{5}}\).
(a) Use a graphing device to draw the graph of \(f\).
(b) State approximately the intervals on which \(f\) is increasing and on which \(f\) is decreasing.

Enter your answer directly below each part above.

30 Skill - Intervals of Increase and Decrease from Function · Level 2
A function \(f\) is given by \(f(x) = 4 - x^{\dfrac{2}{3}}\).
(a) Use a graphing device to draw the graph of \(f\).
(b) State approximately the intervals on which \(f\) is increasing and on which \(f\) is decreasing.

Enter your answer directly below each part above.

31 Skill - Local Maxima/Minima and Monotonicity from Graph · Level 2
The graph of a function is given.
question image
(a) Find all the local maximum and minimum values of the function and the value of \(x\) at which each occurs.
(b) Find the intervals on which the function is increasing and on which the function is decreasing.

Enter your answer directly below each part above.

32 Skill - Local Maxima/Minima and Monotonicity from Graph · Level 2
The graph of a function is given.
question image
(a) Find all the local maximum and minimum values of the function and the value of \(x\) at which each occurs.
(b) Find the intervals on which the function is increasing and on which the function is decreasing.

Enter your answer directly below each part above.

33 Skill - Local Maxima/Minima and Monotonicity from Graph · Level 2
The graph of a function is given.
question image
(a) Find all the local maximum and minimum values of the function and the value of \(x\) at which each occurs.
(b) Find the intervals on which the function is increasing and on which the function is decreasing.

Enter your answer directly below each part above.

34 Skill - Local Maxima/Minima and Monotonicity from Graph · Level 2
The graph of a function is given.
question image
(a) Find all the local maximum and minimum values of the function and the value of \(x\) at which each occurs.
(b) Find the intervals on which the function is increasing and on which the function is decreasing.

Enter your answer directly below each part above.

35 Skill - Local Extrema and Monotonicity from Function · Level 3
A function is given by \(f(x) = x^3 - x\).
(a) Find all the local maximum and minimum values of the function and the value of \(x\) at which each occurs. State each answer correct to two decimal places.
(b) Find the intervals on which the function is increasing and on which the function is decreasing. State each answer correct to two decimal places.

Enter your answer directly below each part above.

36 Skill - Local Extrema and Monotonicity from Function · Level 3
A function is given by \(f(x) = 3 + x + x^2 - x^3\).
(a) Find all the local maximum and minimum values of the function and the value of \(x\) at which each occurs. State each answer correct to two decimal places.
(b) Find the intervals on which the function is increasing and on which the function is decreasing. State each answer correct to two decimal places.

Enter your answer directly below each part above.

37 Skill - Local Extrema and Monotonicity from Function · Level 3
A function is given by \(g(x) = x^4 - 2 x^3 - 11 x^2\).
(a) Find all the local maximum and minimum values of the function and the value of \(x\) at which each occurs. State each answer correct to two decimal places.
(b) Find the intervals on which the function is increasing and on which the function is decreasing. State each answer correct to two decimal places.

Enter your answer directly below each part above.

38 Skill - Local Extrema and Monotonicity from Function · Level 3
A function is given by \(g(x) = x^5 - 8 x^3 + 20 x\).
(a) Find all the local maximum and minimum values of the function and the value of \(x\) at which each occurs. State each answer correct to two decimal places.
(b) Find the intervals on which the function is increasing and on which the function is decreasing. State each answer correct to two decimal places.

Enter your answer directly below each part above.

39 Skill - Local Extrema and Monotonicity from Function · Level 3
A function is given by \(U(x) = x \sqrt{6 - x}\).
(a) Find all the local maximum and minimum values of the function and the value of \(x\) at which each occurs. State each answer correct to two decimal places.
(b) Find the intervals on which the function is increasing and on which the function is decreasing. State each answer correct to two decimal places.

Enter your answer directly below each part above.

40 Skill - Local Extrema and Monotonicity from Function · Level 3
A function is given by \(U(x) = x \sqrt{x - x^2}\).
(a) Find all the local maximum and minimum values of the function and the value of \(x\) at which each occurs. State each answer correct to two decimal places.
(b) Find the intervals on which the function is increasing and on which the function is decreasing. State each answer correct to two decimal places.

Enter your answer directly below each part above.

41 Skill - Local Extrema and Monotonicity from Function · Level 3
A function is given by \(V(x) = \dfrac{1 - x^2}{x^3}\).
(a) Find all the local maximum and minimum values of the function and the value of \(x\) at which each occurs. State each answer correct to two decimal places.
(b) Find the intervals on which the function is increasing and on which the function is decreasing. State each answer correct to two decimal places.

Enter your answer directly below each part above.

42 Skill - Local Extrema and Monotonicity from Function · Level 3
A function is given by \(V(x) = \dfrac{1}{x^2 + x + 1}\).
(a) Find all the local maximum and minimum values of the function and the value of \(x\) at which each occurs. State each answer correct to two decimal places.
(b) Find the intervals on which the function is increasing and on which the function is decreasing. State each answer correct to two decimal places.

Enter your answer directly below each part above.

43 Application - Power Consumption · Level 2
The figure shows the power consumption in San Francisco for September 19, 1996 (\(P\) is measured in megawatts; \(t\) is measured in hours starting at midnight).
question image
(a) What was the power consumption at 6:00 A.M.? At 6:00 P.M.?
(b) When was the power consumption the lowest?
(c) When was the power consumption the highest?

Enter your answer directly below each part above.

44 Application - Earthquake Acceleration · Level 2
The graph shows the vertical acceleration of the ground from the 1994 Northridge earthquake in Los Angeles, as measured by a seismograph. (Here \(t\) represents the time in seconds.)
question image
(a) At what time \(t\) did the earthquake first make noticeable movements of the earth?
(b) At what time \(t\) did the earthquake seem to end?
(c) At what time \(t\) was the maximum intensity of the earthquake reached?

Enter your answer directly below each part above.

45 Application - Weight Function · Level 2
The graph gives the weight \(W\) of a person at age \(x\).
question image
(a) Determine the intervals on which the function \(W\) is increasing and those on which it is decreasing.
(b) What do you think happened when this person was 30 years old?

Enter your answer directly below each part above.

46 Application - Distance Function · Level 2
The graph gives a sales representative's distance from his home as a function of time on a certain day.
question image
(a) Determine the time intervals on which his distance from home was increasing and those on which it was decreasing.
(b) Describe in words what the graph indicates about his travels on this day.

Enter your answer directly below each part above.

47 Application - Changing Water Levels · Level 2
The graph shows the depth of water \(W\) in a reservoir over a one-year period as a function of the number of days \(x\) since the beginning of the year.
question image
(a) Determine the intervals on which the function \(W\) is increasing and on which it is decreasing.
(b) At what value of \(x\) does \(W\) achieve a local maximum? A local minimum?

Enter your answer directly below each part above.

48 Application - Hurdle Race Graph Interpretation · Level 2
Three runners compete in a \(100\)-meter hurdle race. The graph depicts the distance run as a function of time for each runner. Describe in words what the graph tells you about this race. Who won the race? Did each runner finish the race? What do you think happened to runner B?
question image
49 Application - Gravity Near the Moon · Level 2
We can use Newton's Law of Gravity to measure the gravitational attraction between the moon and an algebra student in a space ship located a distance \(x\) above the moon's surface: \(F(x) = \dfrac{350}{x^2}\). Here \(F\) is measured in newtons (N), and \(x\) is measured in millions of meters. (a) Graph the function \(F\) for values of \(x\) between \(0\) and \(10\). (b) Use the graph to describe the behavior of the gravitational attraction \(F\) as the distance \(x\) increases.
50 Application - Stefan-Boltzmann Law (Radii of Stars) · Level 2
Astronomers infer the radii of stars using the Stefan Boltzmann Law: \(E(T) = (5.67 \times 10^{-8}) T^4\) where \(E\) is the energy radiated per unit of surface area measured in watts (W) and \(T\) is the absolute temperature measured in kelvins (K). (a) Graph the function \(E\) for temperatures \(T\) between \(100\) K and \(300\) K. (b) Use the graph to describe the change in energy \(E\) as the temperature \(T\) increases.
51 Application - Migrating Fish Energy Minimization · Level 3
A fish swims at a speed \(v\) relative to the water, against a current of \(5\) mi/h. Using a mathematical model of energy expenditure, it can be shown that the total energy \(E\) required to swim a distance of \(10\) mi is given by \(E(v) = 2.73 v^3 \cdot \dfrac{10}{v - 5}\). Biologists believe that migrating fish try to minimize the total energy required to swim a fixed distance. Find the value of \(v\) that minimizes energy required. NOTE: This result has been verified; migrating fish swim against a current at a speed 50% greater than the speed of the current.
52 Application - Highway Traffic Flow Maximization · Level 3
A highway engineer wants to estimate the maximum number of cars that can safely travel a particular highway at a given speed. She assumes that each car is \(17\) ft long, travels at a speed \(s\), and follows the car in front of it at the "safe following distance" for that speed. She finds that the number \(N\) of cars that can pass a given point per minute is modeled by the function \(N(s) = \dfrac{88 s}{17 + 17 \left(\dfrac{s}{20}\right)^2}\). At what speed can the greatest number of cars travel the highway safely?
53 Application - Volume of Water (Density Minimum) · Level 3
Between \(0\)°C and \(30\)°C, the volume \(V\) (in cubic centimeters) of \(1\) kg of water at a temperature \(T\) is given by the formula \(V = 999.87 - 0.06426 T + 0.0085043 T^2 - 0.0000679 T^3\). Find the temperature at which the volume of \(1\) kg of water is a minimum.
54 Application - Coughing Velocity Maximization · Level 3
When a foreign object that is lodged in the trachea (windpipe) forces a person to cough, the diaphragm thrusts upward, causing an increase in pressure in the lungs. At the same time, the trachea contracts, causing the expelled air to move faster and increasing the pressure on the foreign object. According to a mathematical model of coughing, the velocity \(v\) of the airstream through an average-sized person's trachea is related to the radius \(r\) of the trachea (in centimeters) by the function \(v(r) = 3.2 (1 - r) r^2\) for \(\dfrac{1}{2} \leq r \leq 1\). Determine the value of \(r\) for which \(v\) is a maximum.
55 Discussion - Always Increasing or Decreasing Functions · Level 2
Sketch rough graphs of functions that are defined for all real numbers and that exhibit the indicated behavior (or explain why the behavior is impossible). (a) \(f\) is always increasing, and \(f(x) > 0\) for all \(x\). (b) \(f\) is always decreasing, and \(f(x) > 0\) for all \(x\). (c) \(f\) is always increasing, and \(f(x) < 0\) for all \(x\). (d) \(f\) is always decreasing, and \(f(x) < 0\) for all \(x\).
56 Discussion - Real-World Maxima and Minima · Level 1
In Example 7 we saw a real-world situation in which the maximum value of a function is important. Name several other everyday situations in which a maximum or minimum value is important.
57 Discussion - Minimizing Distance to a Parabola · Level 4
When we seek a minimum or maximum value of a function, it is sometimes easier to work with a simpler function instead. (a) Suppose \(g(x) = \sqrt{f(x)}\) where \(f(x) \geq 0\) for all \(x\). Explain why the local minima and maxima of \(f\) and \(g\) occur at the same values of \(x\). (b) Let \(g(x)\) be the distance between the point \((3, 0)\) and the point \((x, x^2)\) on the graph of the parabola \(y = x^2\). Express \(g\) as a function of \(x\). (c) Find the minimum value of the function \(g\) that you found in part (b). Use the principle described in part (a) to simplify your work.
58 Example - Finding Values from a Graph · Level 2
*EXAMPLE 1: Finding the Values of a Function from a Graph.* The function \(T\) graphed in Figure 1 gives the temperature (in degrees Fahrenheit) between noon and 6:00 P.M. at a certain weather station. (a) Find \(T(1)\), \(T(3)\), and \(T(5)\). (b) Which is larger, \(T(2)\) or \(T(4)\)? (c) Find the value(s) of \(x\) for which \(T(x) = 25\). (d) Find the value(s) of \(x\) for which \(T(x) \geq 25\).
question image
59 Example - Domain and Range from Graph · Level 2
*EXAMPLE 2: Finding the Domain and Range from a Graph.* (a) Use a graphing calculator to draw the graph of \(f(x) = \sqrt{4 - x^2}\). (b) Find the domain and range of \(f\).
question image
60 Example - Intervals of Increase and Decrease · Level 2
*EXAMPLE 3: Intervals on Which a Function Increases and Decreases.* The graph in Figure 5 gives the weight \(W\) of a person at age \(x\). Determine the intervals on which the function \(W\) is increasing and on which it is decreasing.
question image
61 Example - Intervals of Increase and Decrease from Polynomial · Level 3
*EXAMPLE 4: Finding Intervals Where a Function Increases and Decreases.* (a) Sketch a graph of the function \(f(x) = 12 x^2 + 4 x^3 - 3 x^4\). (b) Find the domain and range of \(f\). (c) Find the intervals on which \(f\) increases and decreases.
question image
62 Example - Finding Intervals Where a Function Increases and Decreases · Level 2
Let \(f(x) = x^{\dfrac{2}{3}}\).
question image
(a) Sketch the graph of the function \(f\).
(b) Find the domain and range of the function.
(c) Find the intervals on which \(f\) increases and decreases.

Enter your answer directly below each part above.

63 Example - Finding Local Maxima and Minima from a Graph · Level 3
Find the local maximum and minimum values of the function \(f(x) = x^3 - 8 x + 1\), correct to three decimal places.
question image
64 Example - A Model for the Food Price Index · Level 3
A model for the food price index (the price of a representative basket of foods) between 1990 and 2000 is given by the function \(I(t) = -0.0113 t^3 + 0.0681 t^2 + 0.198 t + 99.1\) where \(t\) is measured in years since midyear 1990, so \(0 \leq t \leq 10\), and \(I(t)\) is scaled so that \(I(3) = 100\). Estimate the time when food was most expensive during the period 1990-2000.
question image

Answered: 0 / 64